| Bus/Ind | Eng/Sci | Onsites | Public | Virtual | Manuals | Rewards | Contact |
Home > Excel Classes > Excel Data Analysis Eng/Sci
| Bus/Ind | Eng/Sci | Onsites | Public | Virtual | Manuals | Rewards | Contact |
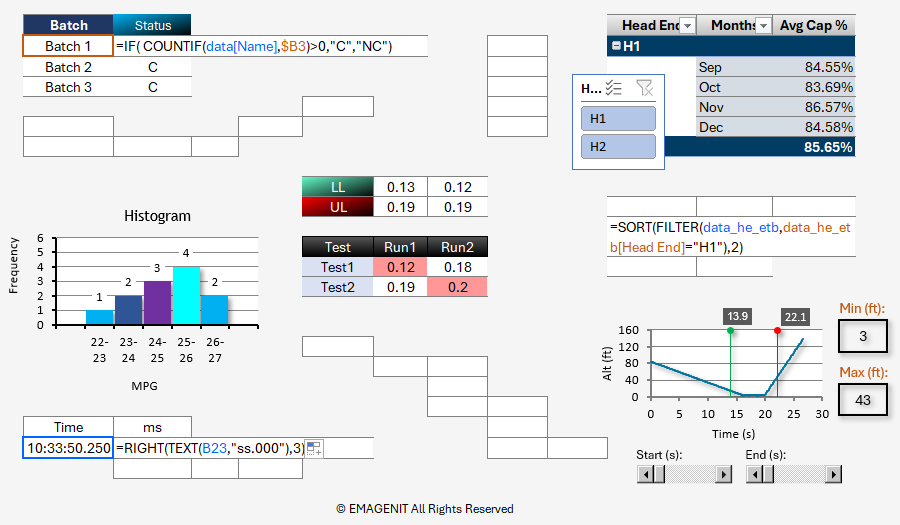
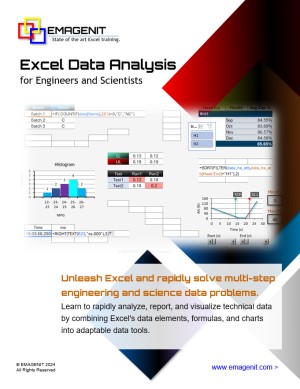
Learn to analyze, report, and visualize data by combining Excel's data elements, formulas, and charts into adaptive data tools.
Next Class: Check Dates
View and Download Brochure
|
|
|
|
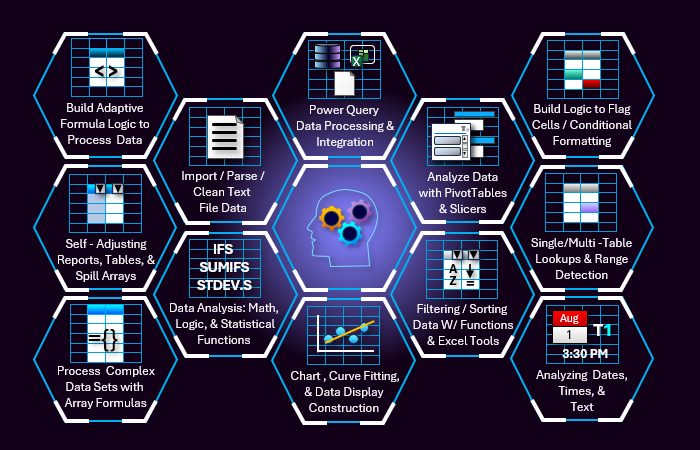
Learn to use formulas, Excel tables, spill over arrays, and filter functions to track, organize, and consolidate data automatically.
Learn to use formula logic and functions to make data decisions and to sum, count, and analyze data based on criteria.
Learn to use logic, functions, and Conditional Formatting to flag data, create adaptive problem formatting, and design data visualization tools.
Learn to use Excel's data tools to filter data and the Analysis Toolpak to rapidly perform various statistical analyses on your data sets.
Learn how to perform hi-tech table look ups with various functions and return columns, rows, and parts of tables in your formulas.
Learn to create various technical charts, perform curve fits, and create visual displays by combining charts, shapes, slicers, and controls.
Learn to use array formulas to analyze and filter complex data, and use functions to perform various text, date/time, and statistical operations.
Learn to link and format external data with Power Query and use PivotTables to create tables and rapidly summarize data.
 |
 |
 |
 |
 |
 |
 |
 |

Live Virtual We can train you live, hands-on virtually over the web. |

Live In-Person We can train you in person, hands-on at a public class. |
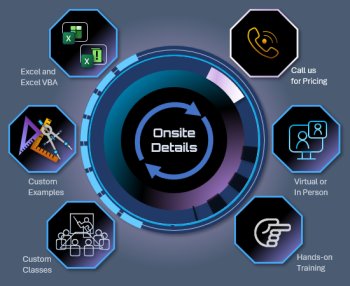
Business Onsite We can train your business live in-person or virtually anywhere. |
Self-Study Manual Buy the self-study manual now, apply the price to a class later. |
| Dates | Price | Time | Details | Time Zone | Purchase |
|---|---|---|---|---|---|
| 07/10/26 | $149.00 | 9:00 - 5:00 CT | Virtual Details > | Central Time |
Add to Cart
|
| 08/07/26 | $149.00 | 9:00 - 5:00 CT | Virtual Details > | Central Time |
Add to Cart
|
| 09/08/26 | $149.00 | 9:00 - 5:00 CT | Virtual Details > | Central Time |
Add to Cart
|
| 07/10/26 | $189.00 | 9:00 - 5:00 CT | Public Details > | Nashville, TN |
Add to Cart
|
| 08/07/26 | $189.00 | 9:00 - 5:00 CT | Public Details > | Nashville, TN |
Add to Cart
|
| 09/08/26 | $189.00 | 9:00 - 5:00 CT | Public Details > | Nashville, TN |
Add to Cart
|
Phone Number: 1.629.325.9937
Business Hours: Mon-Fri 8:00 AM - 7:00 PM CT
You can email us at info@emagenit.com >
Excel Training Services
Excel Classes - Business and Industry
Beginning Excel for Business and Industry
Intermediate Excel for Business and Industry
Advanced Excel for Business and Industry
Excel Dashboards for Business and Industry
Beginning Excel VBA for Business and Industry
Excel Classes - Engineers / Scientists
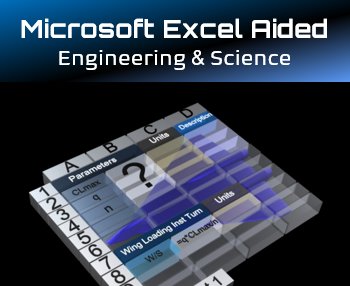
Microsoft Excel Essentials for Engineers and Scientists
Excel Data Analysis for Engineers and Scientists
Excel VBA Fundamentals for Engineers and Scientists
Excel VBA Data Analysis for Engineers and Scientists
Microsoft Excel Manuals
Microsoft Excel Solutions Handbook
Creating Advanced Excel VBA Apps
Microsoft Excel All-in-One Manual
Excel VBA Design for Engineers and Scientists
Advanced Excel VBA Design for Engineers and Scientists
EMAGENIT Company Information
US Military
Copyright © 2026. EMAGENIT All Rights Reserved
