| Schedule | Classes | Onsites | Manuals | Customers | Contact | About |
Home > Excel Classes > Excel for Engineers and Scientists
| Schedule | Classes | Onsites | Manuals | Customers | Contact | About |
Learn to harness Excel's powerful calculation, charting, data, and interface abilities to build problem solving tools. Includes LAMBDA custom function discussion. Class Examples >
Next Class: Check Dates
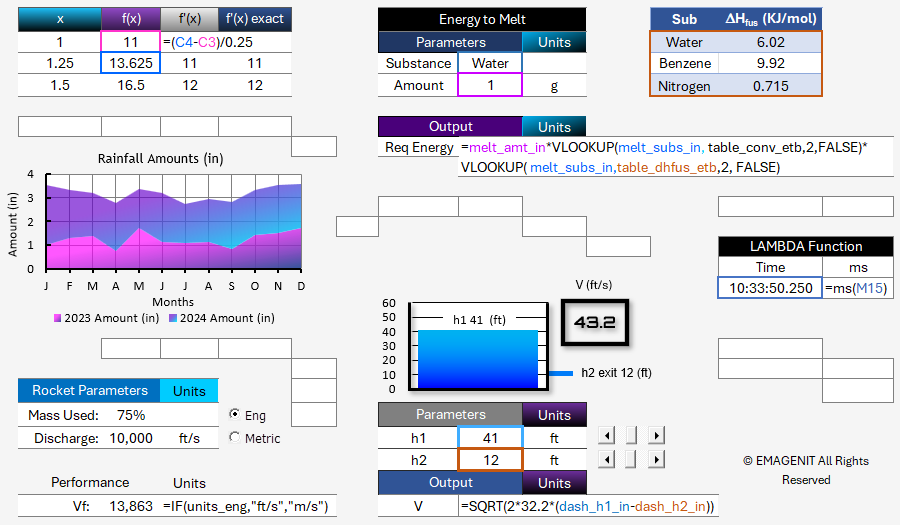
Our 1-day class shows you the Excel skills needed to assemble a wide variety of problem-solving tools. It covers the basics like how to create formulas; use names and cell references; link data; control cell inputs; use formula logic; and lookup data. It also shows how to build tables, create technical charts, and layout problems and models.
In addition to the basics, it shows how to build technical forms; use key worksheet functions; collate and process data; and solve numerical methods. We also cover how to create illustrations that update automatically and build custom functions using LAMBDA.
Read our detailed outline > below and see what you'll discover in our class.
|
|
|
|
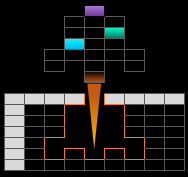
Learn about problem / model layout; formula design; cell references and naming; and creating diagrams that auto-update.
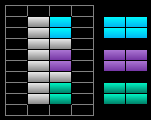
Learn to control cell inputs with Data Validation/ActiveX and flag cell values using logic/Conditional Formatting.
Learn to debug your formulas, trace cell calculation sequence, and trace where cell inputs are used in formulas.
Learn to organize data in Excel tables, process data with Excel's data tools, and use key functions that auto filter data.
Learn to use key worksheet functions, table lookups, logic, and Excel table references to perform techincal calculations.
Learn about form construction, worksheet formatting, linking sheets and workbooks, and data consolidation.
Learn to organize chart data; format charts; and create various technical charts, combo charts, and multi-table charts.
Learn to solve numerical methods in Excel and create custom worksheet functions (LAMBDA) to replace cumbersome formulas.
 |
 |
 |
 |
 |
 |
 |
 |
Download Class Brochure
Phone Number: 1.629.325.9937
Business Hours: Mon-Fri 8:00 AM - 7:00 PM CT
You can email us at info@emagenit.com >
Excel Training Services
Excel Classes - Business and Industry
Beginning Excel for Business and Industry
Intermediate Excel for Business and Industry
Advanced Excel for Business and Industry
Excel Dashboards for Business and Industry
Beginning Excel VBA for Business and Industry
Excel Classes - Engineers / Scientists
Microsoft Excel for Engineers for Scientists
Excel Data Analysis for Engineers and Scientists
Excel VBA for Engineers and Scientists
Excel VBA Data Analysis for Engineers and Scientists
Microsoft Excel Manuals
Microsoft Excel Solutions Handbook
Creating Advanced Excel VBA Apps
Excel VBA Handbook for Engineers and Scientists
Excel VBA App Design for Engineers and Scientists
EMAGENIT Company Information
US Military
Copyright © 2025. EMAGENIT All Rights Reserved